
Data show that student learning growth occurred even as the state’s annual performance review failed to make measurable changes in the teaching ranks.
New York state emerged as an early proponent of ramping up the quality of teacher evaluations in the belief that student learning would improve. But just as quickly, the same state gave birth to the opt-out movement when parents saw the potential for problems when evaluations were linked to student test results, and thousands of kids refused to take statewide tests.
So several years into this experiment of linking teacher evaluation and student test results, it’s fair to ask: Did the most aggressive program for teacher and principal evaluation succeed? Did this plan improve student learning? What other lessons can be learned?
First, the background. In 2012, New York education officials and the state’s teachers union agreed to one of the nation’s most aggressive programs for teacher and principal evaluation. The Annual Professional Performance Review system (APPR) required that 40% of an educator’s evaluation be based on student growth, using a combination of state assessment and locally selected assessments; the other 60% was to be based primarily on classroom observations.
The combined performance of an educator in each of these areas was translated into four rating categories: Highly Effective, Effective, Developing, or Ineffective. Educators who received two consecutive Ineffective ratings could be terminated regardless of tenure status. In addition, educators who received an Ineffective rating on the student test result component would automatically receive an overall rating of Ineffective, regardless of how the principal rated classroom performance.
While the teachers union initially supported APPR, a coalition of teachers, administrators, and parents soon opposed the program. Their opposition coalesced around a movement to have students opt out of statewide testing. The movement had a dramatic effect on New York parents, and in the 2014-15 school year, 20% of students in grades 3 through 8 who were eligible for statewide testing opted out (Ujifusa, 2015).
The state’s initial response to the opt-out movement was to double down on the evaluation policy by making changes intended to increase the number of educators with Ineffective ratings. The Education Transformation Act, enacted in April 2015, increased the weighting of the state assessment results to 50%; subsequent regulations required that students demonstrate performance equivalent to a year of growth on local assessments in order for teachers to receive ratings above Ineffective. Where student learning objectives were part of the evaluation process, the regulations required that 60% of students achieve a year of growth for a teacher to gain a rating above Ineffective (New York State United Teachers, 2016).
The opt-out movement seemed to have an effect on Gov. Andrew Cuomo, who led the changes. Despite investing much political capital to implement an evaluation system in which poor student results would lead to teacher dismissals, Cuomo reversed this policy. On Dec. 13, 2015, the New York Board of Regents, acting on recommendations of a task force with the governor’s approval, voted in favor of a four-year moratorium on using state test scores as a component of teacher evaluation (Taylor, 2015).
In theory, the purposes of the APPR system is to ensure that every classroom has an effective teacher, promote professional growth among teachers, and encourage improvement in classroom instructional practice.
In theory, the APPR system is intended to ensure that every classroom has an effective teacher, promote professional growth among teachers, and encourage improvement in classroom instructional practice (NYSED, 2014). Unfortunately, while there has been much discussion about whether students are overtested and debate about whether student test results accurately measure teacher performance, the political debate around APPR and its subsequent changes have been virtually devoid of any discussion or evidence about APPR’s effect on student outcomes. After all, it seems reasonable that if the APPR program was meeting its stated goal, then changes in student outcomes would eventually become visible.
How then do we introduce the effect of APPR on student learning into the discussion? Let’s concede that it is challenging because APPR was not implemented in a laboratory-like environment. APPR’s launch program coincided with the state’s introduction of Common Core standards, the adoption of new state assessments in support of those standards, and increased cut scores on state assessments that reflected college- and career-ready expectations for students (Cronin & Jensen, 2014). Further, the program was launched during an economic decline in which teachers and administrators were being laid off in the wake of the 2007 recession. In 2011 alone, New York reduced its teacher force by 5% through layoffs and retirements, which adds a further level of complexity to evaluating APPR’s effect on learning (Associated Press, 2011).
Method and sample
It is virtually impossible to judge the effect of APPR by evaluating longitudinal results from New York state assessments because of changes in the design of the state assessment and their associated cut scores during APPR implementation. However, nearly 100 New York school systems used the Northwest Evaluation Association™ (NWEA™) Measures of Academic Progress® (MAP®) assessments throughout APPR implementation, and this group of schools can provide meaningful information about the possible effect of the policy on student outcomes.
NWEA MAP assessments are administered in over 7,000 school systems in the U.S. and internationally. These assessments are aligned to a state’s curricular standards, and because questions for each test are drawn from a single pool of items calibrated to a single scale, test results can be compared across time even when curriculum standards change. Further, MAP tests are computer-adaptive, meaning that question difficulty adapts based on the accuracy of student answers. For example, if a student gets an item correct on an adaptive assessment, the next item the student receives will be more difficult. If that item is missed, the next item offered will be easier, and so on. This adaptive process results in high levels of precision in estimating student achievement. Because the MAP assessments are not constrained by grade and use a cross-grade scale, the assessments are well-suited to measuring student growth over time. The MAP assessments are supported by robust achievement and growth norms (NWEA, 2011; Thum & Hauser, 2015).
In this analysis, we identified New York schools that administered the MAP assessments for four consecutive years, starting with the school year before APPR implementation (2010-11) and proceeding through the first three years of the program, ending in the 2013-14 school year. In total, 91 schools administered the MAP mathematics assessment and 85 schools administered the MAP reading assessment over this time period. The number of students tested during the period was about 20,000 per year. While the group is not drawn to be demographically representative of the state student population, it is a reasonably large sample for purposes of assessing student achievement and growth over time. The inclusion of student results in the year before APPR implementation provides a baseline that can be used to assess changes in student performance in subsequent years. Because the APPR regulations applied only to 4th- through 8th-grade mathematics and reading teachers in the initial year of program implementation (2010-11), the scope of this analysis was limited to those grades and subjects. The APPR program subsequently expanded to include teachers in all other grade and subject areas starting in the 2012-13 school year.
We evaluated math and reading spring achievement for each school year as well as fall-to-spring growth relative to NWEA’s 2011 nationally representative achievement and growth norms (NWEA, 2011), which was the version schools used during APPR’s implementation. The achievement norms provide information about a student’s learning for any given term compared to students across the nation in the same grade and subject area. NWEA growth norms provide information about the average growth observed for students across the nation during each school year based on their grade, subject, pretest achievement level, and the number of weeks of instruction received by the student.
The status and growth norms allowed for student spring achievement and fall-to-spring growth to be classified as above- or below-average relative to the norming group. Measuring student achievement in the spring allows us to assess the performance of students at the conclusion of each school year in order to see how achievement trends change over time. Further, districts that used MAP assessments in their APPR programs typically measured growth within a school year — from fall to spring — so, for consistency, we chose to focus on fall-to-spring growth in these analyses.
Results
If implementation of the APPR policy were to achieve its stated goals, then NWEA assessment results should show:
- Student achievement improved at the conclusion of each school year; and
- Growth within each school year improved between the year before the program’s implementation and the 2013-14 school year, which represented the third year of the APPR program.
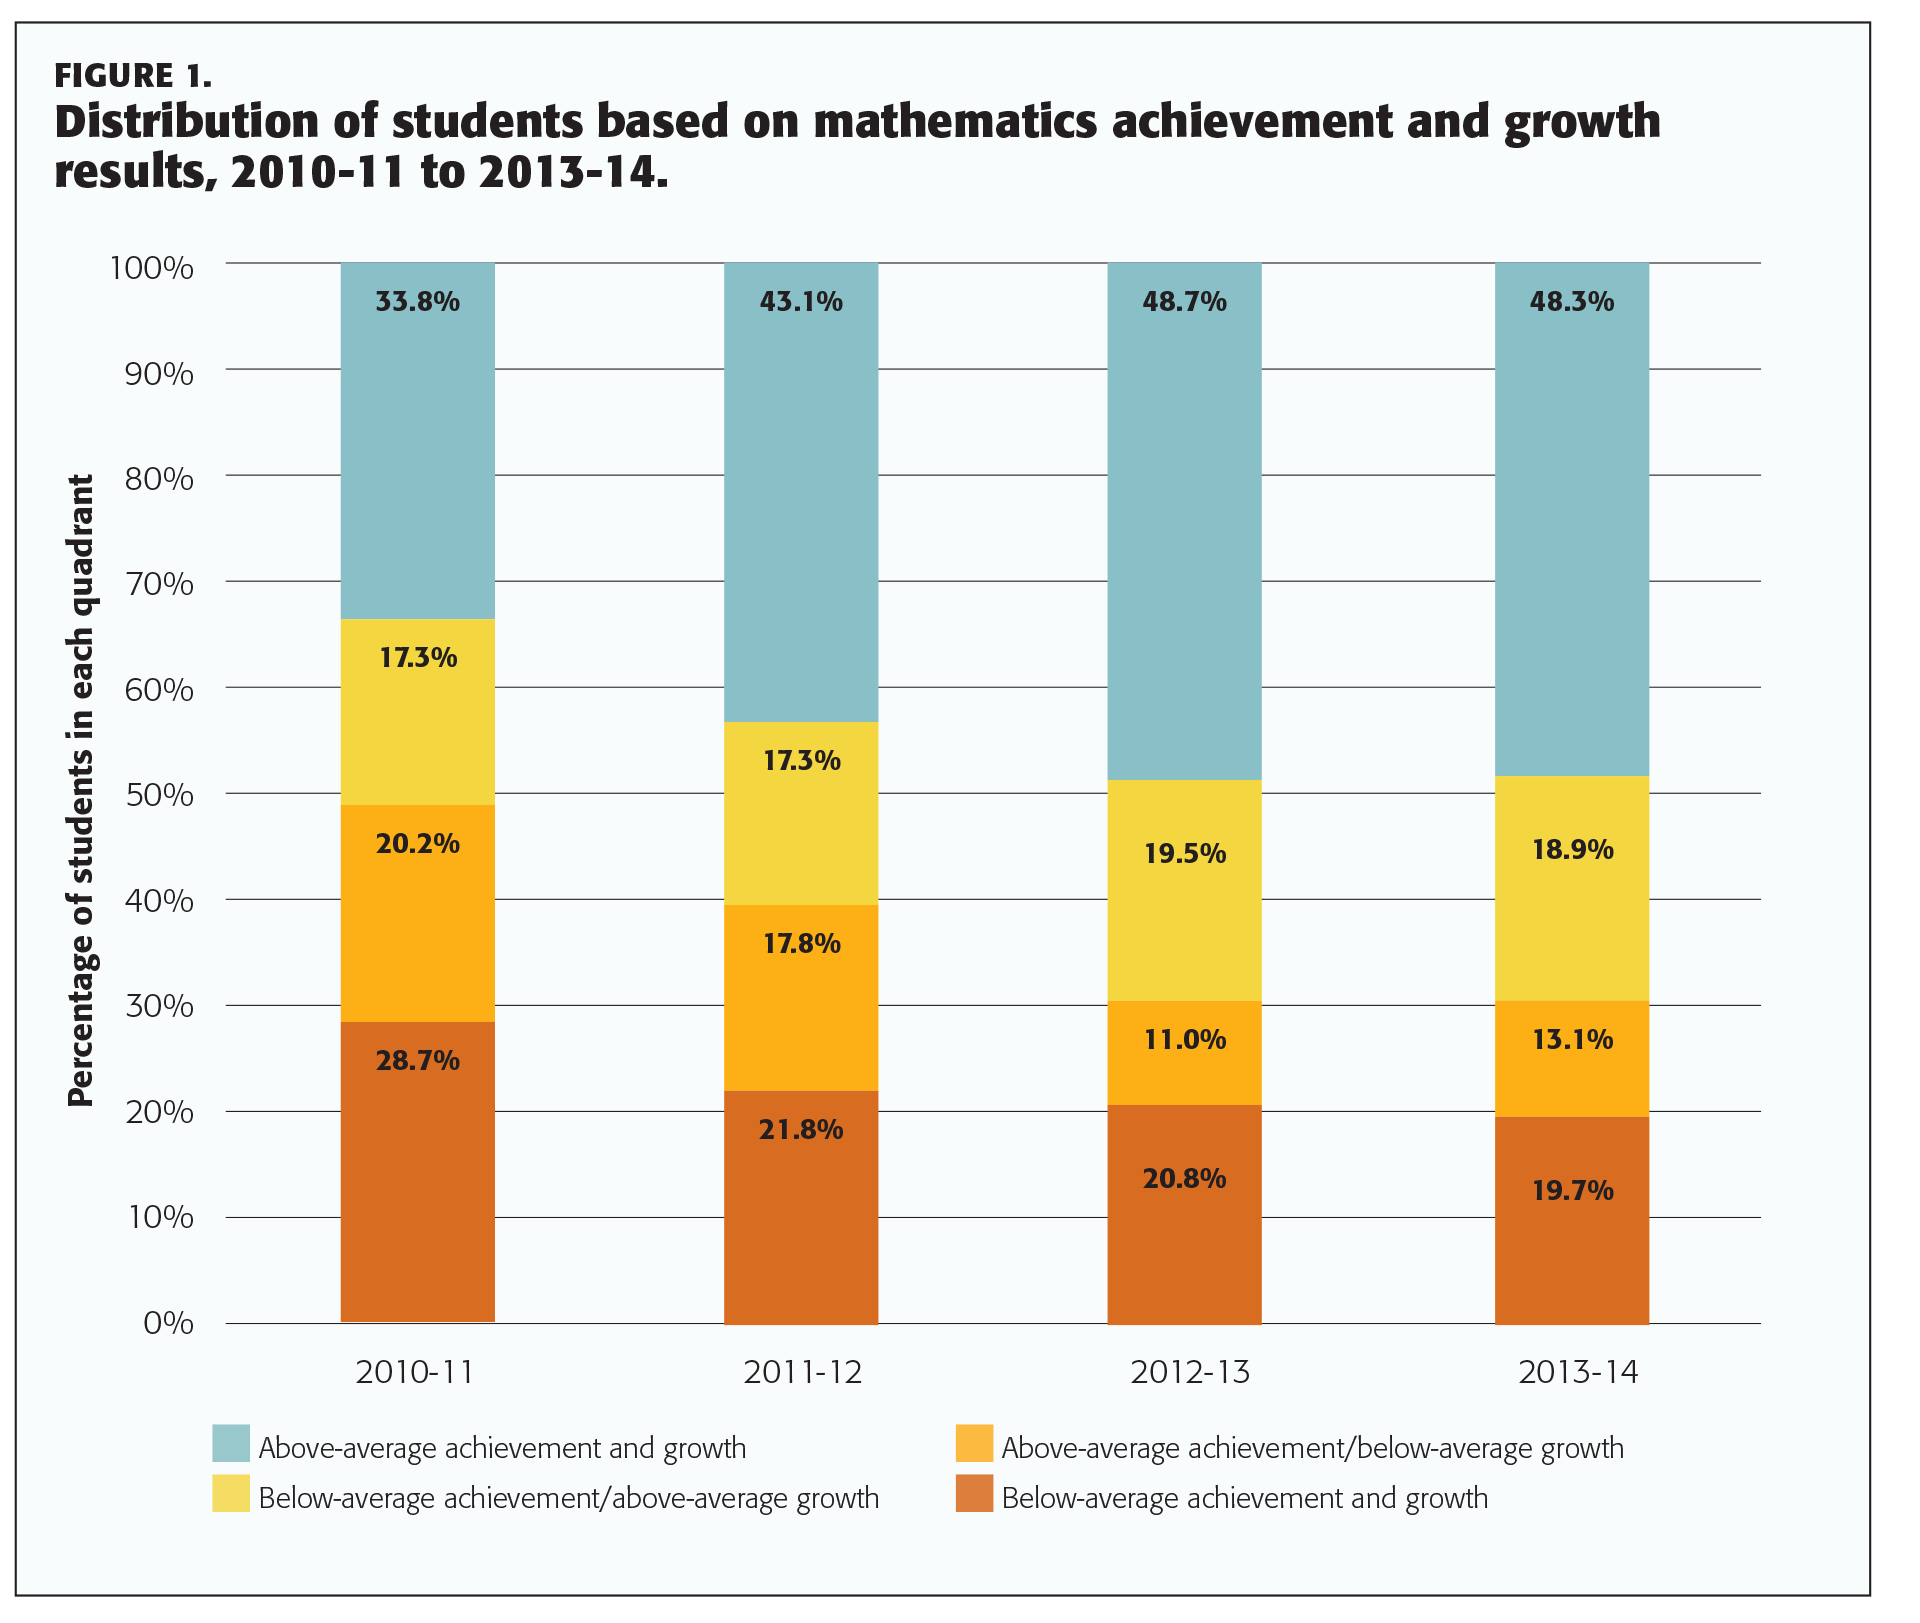
Mathematics results indicate that both student achievement and growth did improve during the time period studied (Figure 1). For example, the proportion of students with above-average achievement and growth improved from about 34% of the sample to 48% of the sample between the year before APPR implementation and the end of the study period. Similarly, the proportion of students showing below-average achievement and growth declined from about 29% of the sample to 20% during the same period.
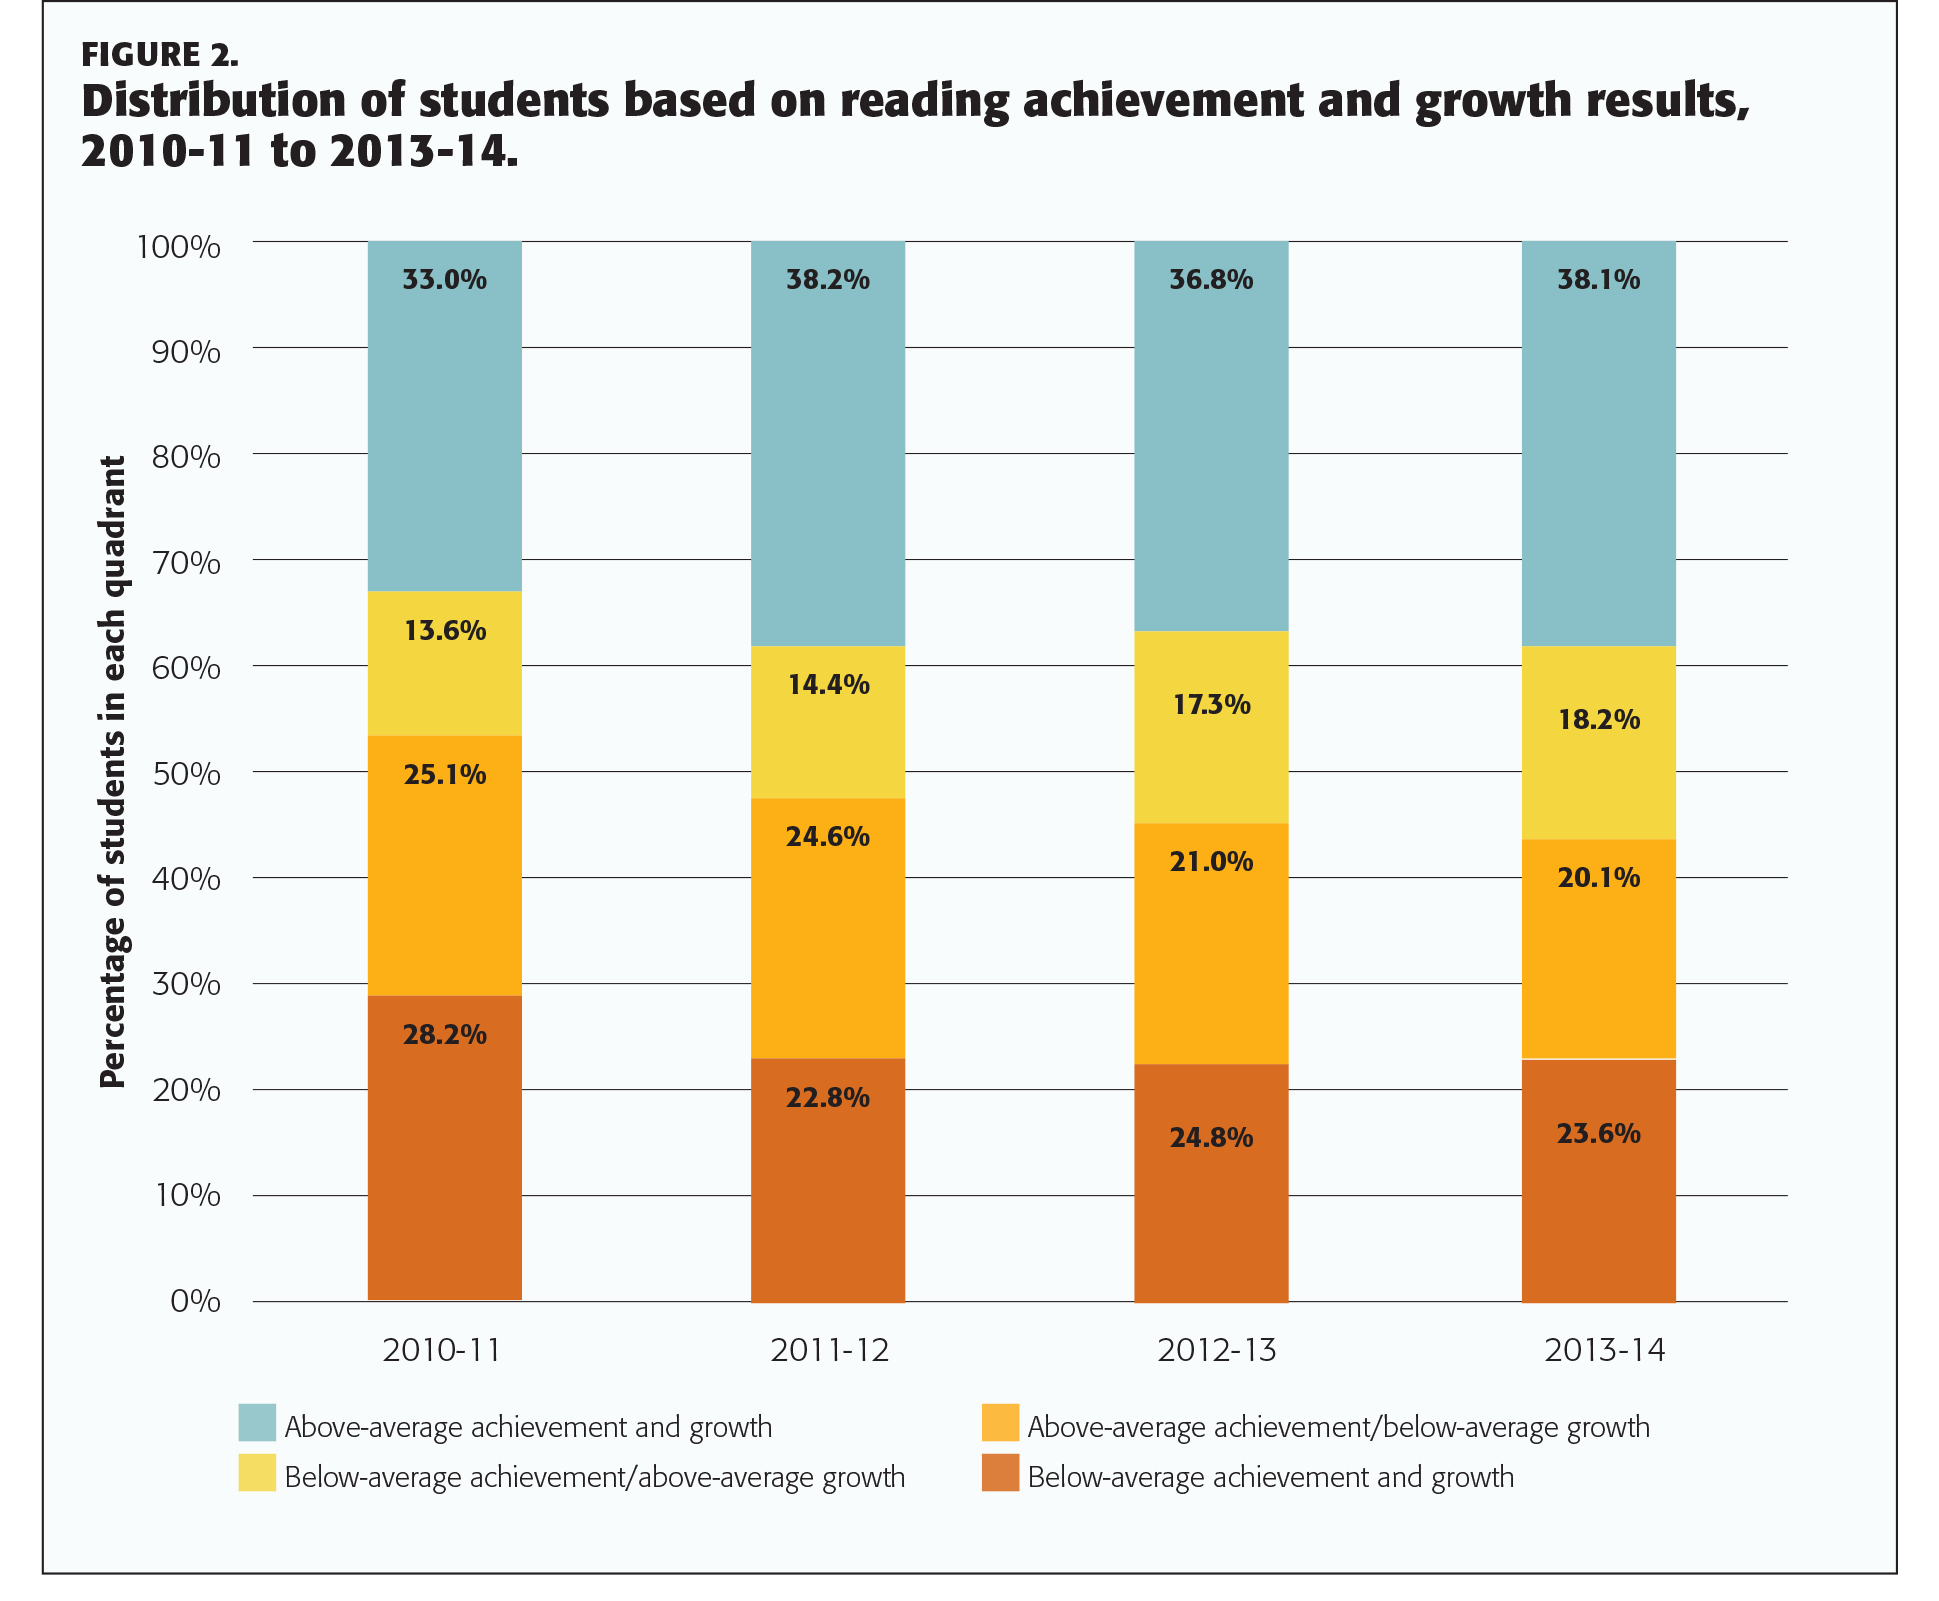
The results in reading were similar, though changes were not as dramatic (Figure 2). The proportion of students showing above-average achievement and growth improved from about 33% to 38% of the sample, while the proportion of students with below-average achievement and growth declined from about 28% to 24% of the sample.
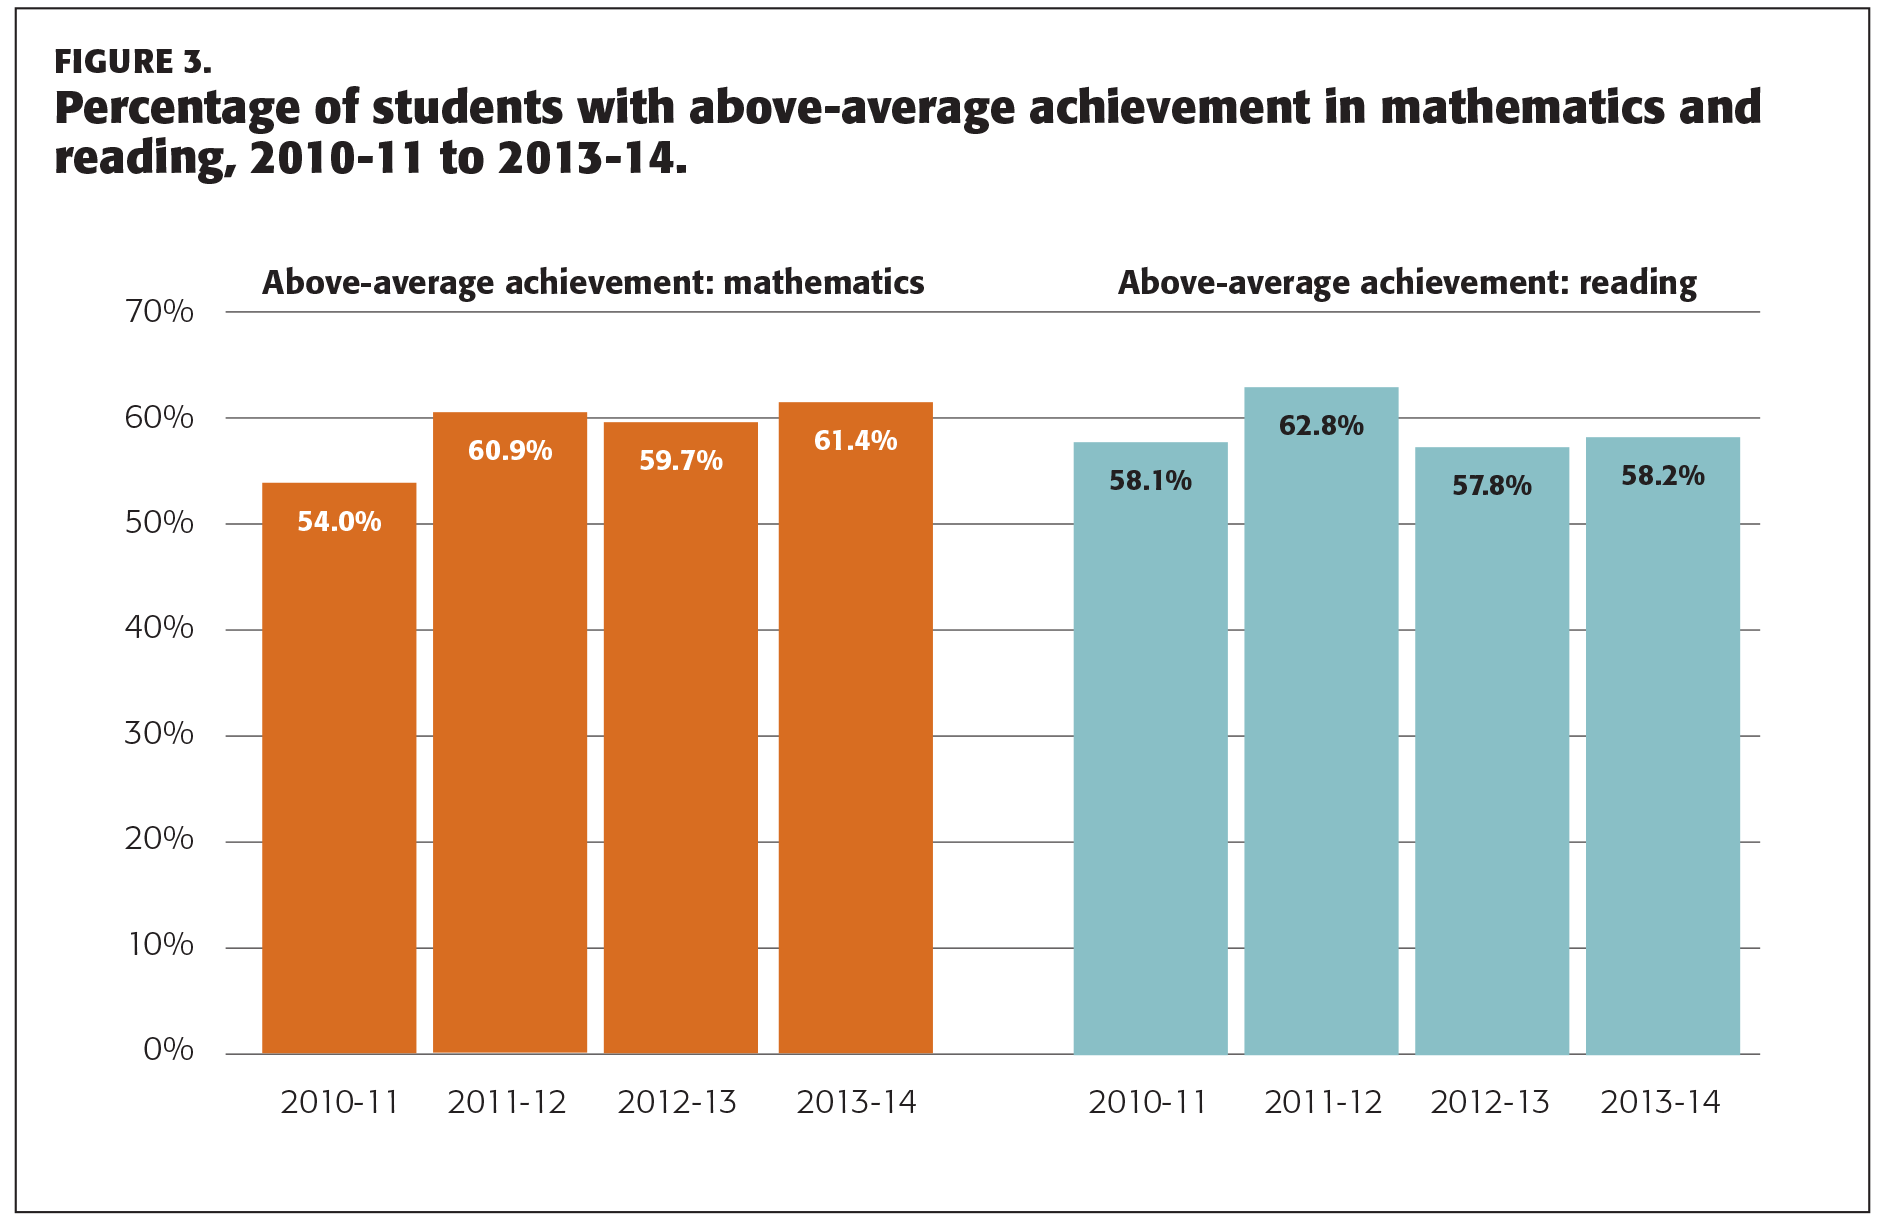
These results point to overall improvement in student outcomes in mathematics. However, while student growth improved in reading over time, these improvements were not fully reflected in increases in student achievement throughout the study period. For example, the proportion of students with above-average achievement in reading improved in the first year of program implementation (2011-12) but reverted back to pre-APPR levels in subsequent years (Figure 3). Conversely, spring mathematics achievement improved in the first year of APPR implementation, and New York students maintained that level of performance though 2013-14.
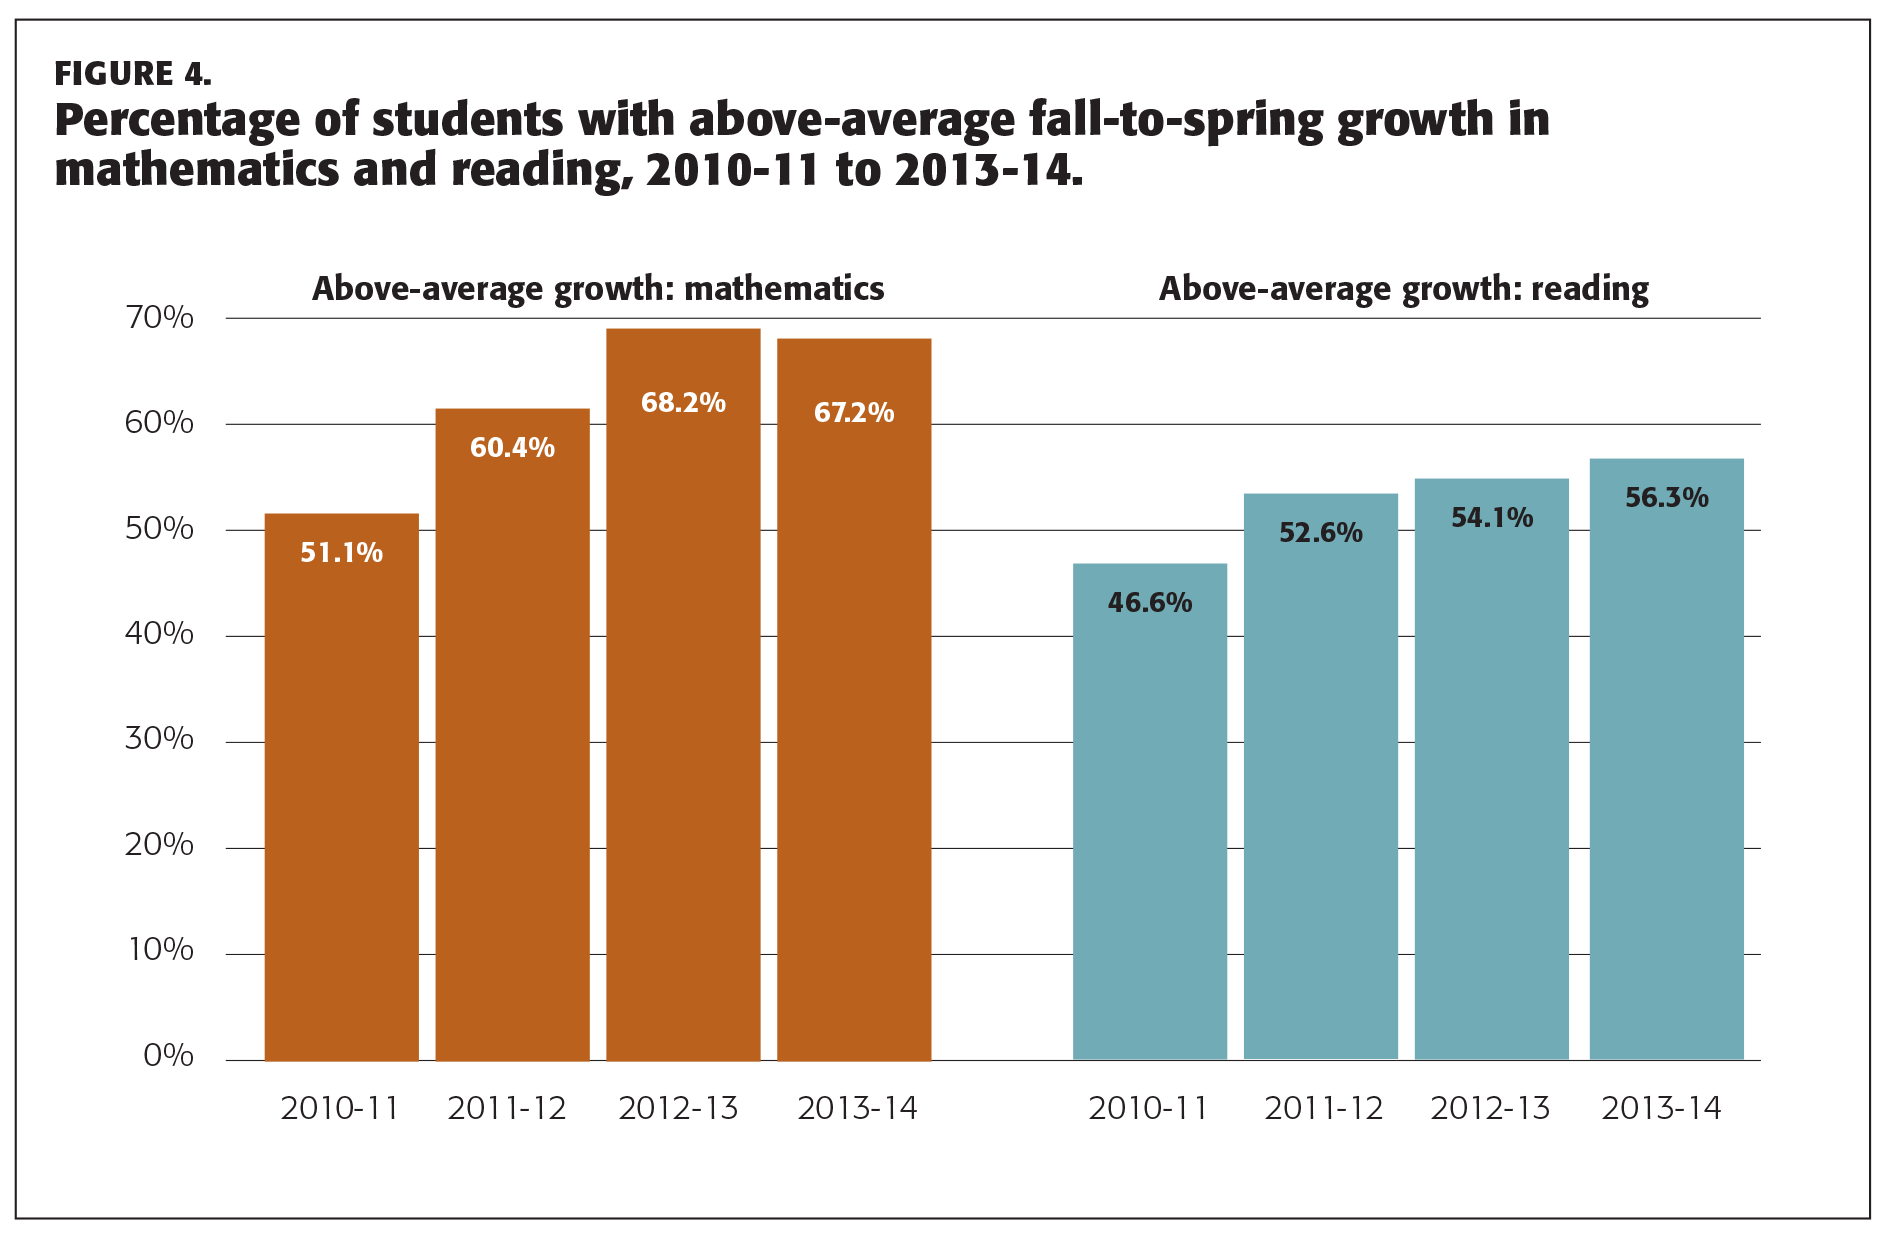
By comparison, results in Figure 4 show how fall-to-spring growth changed. Across both subjects, a greater percentage of students showed above-average growth in the most recent year compared to 2010-11, and these percentages steadily increased over time in both subject areas — with the exception of the most recent year in mathematics. Given the accountability focus on raising student growth within a school year, this trend is not particularly surprising and demonstrates that much of the improvement in reading results shown in Figure 2 is largely the result of steady improvement in student growth, not student achievement. However, mathematics achievement and growth results indicate consistent improvements in student outcomes during the APPR program.
The fact that improvement in growth in reading was not fully reflected in achievement results provided cause for further investigation. What we found was that the types of students tested in the school systems changed in the 2012-13 school year — a year in which the regulations expanded to require all teachers in grades 4 through 8 be evaluated using data from all students. Starting in that year, students who were new to testing had lower test scores than students who had tested previously though their subsequent growth was similar. In short, the expansion of testing to include more lower-performing students had an effect on overall achievement results, even as the new students showed similar rates of growth to students who had previously tested. Thus, the observed discrepancy in achievement and growth is likely a result, at least in part, of changes to the types of students tested in later years of the APPR program.
Discussion
This analysis shows that improvements in the proportion of students showing above-average achievement and growth in this sample of New York students, especially in mathematics, coincided with the implementation of a high-stakes teacher evaluation policy that made student test results an important component of summative performance evaluation. But coincidence doesn’t prove causation. Indeed, several factors make such claims problematic. For example, APPR was not the only major reform implemented during this time period. Many schools also were implementing the Common Core standards; the implementation of these standards coincided with the release of new state assessments with higher cut scores, which were intended to challenge students and teachers to attain higher levels of performance (Cronin & Jensen, 2014). Further, this policy was implemented amid an economic recession, which contributed to a 4% decline in the number of teachers (about 8,000) employed in the state before the study period began (Associated Press, 2011), with some teachers rehired as the policy was being implemented. Given these significant changes in New York, it is not possible to claim that APPR, by itself, is responsible for changes in student outcomes.
Nevertheless, evidence that improvements in student achievement and growth coincided with the implementation of APPR during this time period is relevant and worth our attention because the debate over using test results in performance evaluation so far has lacked data about how these policies affected student achievement. If the goal of improved teacher evaluation policies and procedures is to improve student performance, this kind of data is relevant and should play a critical role in discussions that shape these policies.
Evidence that improvements in student achievement and growth coincided with the implementation of APPR during this time period is relevant and worth our attention because the debate over the use of tests in performance evaluation so far has lacked data regarding the effect of these policies on student achievement.
Advocates for teacher evaluation reform have focused their criticisms of current practices on the perceived failure of schools to find and dismiss incompetent teachers. In this case, improvements in student learning did not coincide with any significant increase in the number of educators fired or rated as Ineffective. While the process of teacher evaluation changed dramatically, the results of teacher evaluations in New York changed little after APPR was implemented. In both the 2012-13 and 2013-14 school years, less than 1% of teachers received an Ineffective rating — the rating that could put them at risk for future dismissal — while over 95% of New York teachers were identified as either Effective or Highly Effective. This suggests that reforms focused on supporting the improvement of the current teaching workforce may have better results than reforms focused more closely on teacher dismissal.
Dismissal rates unchanged
So if higher rates of teacher dismissal don’t explain the improvements in student learning, what other explanations are available? This should be a focus of future research, but APPR may have signaled to teachers and administrators the importance of evaluation. It also likely raised expectations surrounding teacher performance in the classroom and required far more systematic evidence be used in making judgments about performance. Data from state and local assessments were included in the process, but the policy also required more regular classroom observation. Using observational evidence may have increased the seriousness surrounding performance evaluation and also improved the feedback and coaching that teachers gained from the evaluation process. Any of these would be desirable outcomes.
None of these factors require that results from assessments be a controlling factor in the evaluation. In truth, any reforms to teacher evaluation that add more gravity to the process, require more attention on the part of principals to classroom performance, and emphasize the collection and use of evidence might produce similar learning gains. This can be done without a requirement that test scores contribute a fixed percentage (or any percentage) to the evaluation, and data might be used to help teachers better identify and address the strengths and weaknesses of students.
With regard to teacher evaluation, the stated purpose of Race to the Top was “attracting and keeping great teachers and leaders in America’s classrooms, by expanding effective support to teachers and principals; reforming and improving teacher preparation; revising teacher evaluation, compensation, and retention policies to encourage and reward effectiveness; and working to ensure that our most talented teachers are placed in the schools and subjects where they are needed the most” (The White House, Office of the Press Secretary, 2009). These reforms all pointed in the direction of raising teacher effectiveness, and to the extent that has been the goal, it is unfortunate that the discussion to date has been largely devoid of data that could provide that evidence.
ESSA could improve environment
The passage of the Every Student Succeeds Act removes the requirement that teacher evaluations use test scores as a significant part of teacher evaluation. Some states may abandon efforts to improve the evaluation process due to the political polarization associated with this reform effort. However, if the purpose of the reform was to improve student learning, New York offers a counter-example in which changes in the evaluation process coincided with substantive improvements in student growth in reading and mathematics. We should note that the particular approach to reform in New York would not have been our own, as we have advocated for an approach that uses data to help inform teachers’ goal setting and improvement planning; we support leaving summative evaluation decisions in the control of principals.
We do not support using tests as a controlling factor in teacher evaluation, and Gov. Cuomo stepped back from this element of the original APPR after recognizing that the heavy emphasis on test results for evaluating teachers had become politically untenable. However, the results in New York suggest that improvements to the teacher evaluation process that emphasize the importance of strong evaluation procedures, the systematic collection of evidence of teacher performance, and the use of data to inform the process have promise for improving educator effectiveness, and we would encourage models with this emphasis. This approach is most likely to get the support of administrators and teachers and may also be the approach that will have the most positive effect on student achievement over time.
References
Associated Press. (2011, October 12). Report: Layoffs hit 3% of New York teachers. Crain’s New York Business. http://bit.ly/1UMltrW
Cronin, J. & Jensen, N. (2014). The phantom collapse of student achievement in New York. Phi Delta Kappan, 96 (2), 60-66.
New York State Education Department (NYSED). (2014). NY state educator evaluation data. 2013-14 annual professional performance review. Albany, NY: Author. http://bit.ly/1Yo9HXW
New York State United Teachers. (2016, January). Fact sheet 15-13: Annual Professional Performance Review. http://bit.ly/25YspYf
Northwest Evaluation Association. (2011, September). RIT scale norms: For use with Measures of Academic Progress (MAP®) and MAP® for primary grades. Portland, OR: Author.
Taylor, K. (2015, December 14). New York Regents vote to exclude state tests in teacher evaluations. New York Times. http://nyti.ms/1UMnZ1h
Thum, Y.M. & Hauser, C. (2015, July). NWEA 2015 MAP norms for student and school achievement status and growth. Portland, OR: NWEA.
The White House, Office of the Press Secretary. (2009). Fact sheet: The race to the top. Washington, DC: Author.
Ujifusa, A. (2015, August 19). New York’s student opt-out rate for testing hits 20%. Education Week, 35 (1), 4.
Citation: Cronin, J., Jensen, N., & Wise, S. (2016). Students improve even amid evaluation controversy. Phi Delta Kappan, 98 (2), 58-65.
ABOUT THE AUTHORS

John Cronin
JOHN CRONIN is vice president of education research at Northwest Evaluation Association.
Nate Jensen
NATE JENSEN is a senior research scientist at Northwest Evaluation Association.
Steven L. Wise
STEVEN L. WISE is a senior research fellow at Northwest Evaluation Association .


